GTM Diagnose
GTM Diagnose
Know where you stand before you build further
Know where you stand before you build further
Get a clear view of the strengths and bottlenecks in your current Go-to-Market. The GTM Scan assesses 8 critical areas and translates the results into a clear score, actionable recommendations and a prioritized action plan.
Get a clear view of the strengths and bottlenecks in your current Go-to-Market. The GTM Scan assesses 8 critical areas and translates the results into a clear score, actionable recommendations and a prioritized action plan.




The challenge
The challenge
Many commercial teams try to grow without knowing where the real bottlenecks are
More leads, new tools or additional automation will have limited impact if the commercial foundation is not in place. Without a clear understanding of how your market, Sales, data, methodologies, systems and technology work together, it becomes difficult to know where to start.
No shared view of your ideal customer
Your Ideal Customer Profile (ICP) may exist on paper, but it does not function as an operational filter. Marketing targets too broadly and Sales qualifies based on intuition. As a result, every deal is approached differently and success remains difficult to measure and repeat.
Plenty of tools, not enough alignment
Your CRM and other tools contain large amounts of data, but they do not always support the commercial workflow. Information is fragmented, processes are disconnected and the system primarily records what happened instead of helping determine what should happen next.
No clarity on what is holding growth back
The pipeline is active, but results remain difficult to predict. Is the issue targeting, positioning, qualification, follow-up or the underlying process? Without a clear diagnosis, optimization quickly becomes guesswork.
The challenge
Many commercial teams try to grow without knowing where the real bottlenecks are
More leads, new tools or additional automation will have limited impact if the commercial foundation is not in place. Without a clear understanding of how your market, Sales, data, methodologies, systems and technology work together, it becomes difficult to know where to start.
No shared view of your ideal customer
Your Ideal Customer Profile (ICP) may exist on paper, but it does not function as an operational filter. Marketing targets too broadly and Sales qualifies based on intuition. As a result, every deal is approached differently and success remains difficult to measure and repeat.
Plenty of tools, not enough alignment
Your CRM and other tools contain large amounts of data, but they do not always support the commercial workflow. Information is fragmented, processes are disconnected and the system primarily records what happened instead of helping determine what should happen next.
No clarity on what is holding growth back
The pipeline is active, but results remain difficult to predict. Is the issue targeting, positioning, qualification, follow-up or the underlying process? Without a clear diagnosis, optimization quickly becomes guesswork.
GTM Scan
Get an initial view of your Go-to-Market
The free GTM Scan gives you a quick overview of the strength of your commercial foundation. It highlights strengths, potential bottlenecks and the areas that may require further attention.
Map your Go to-Market
Map your Go to-Market
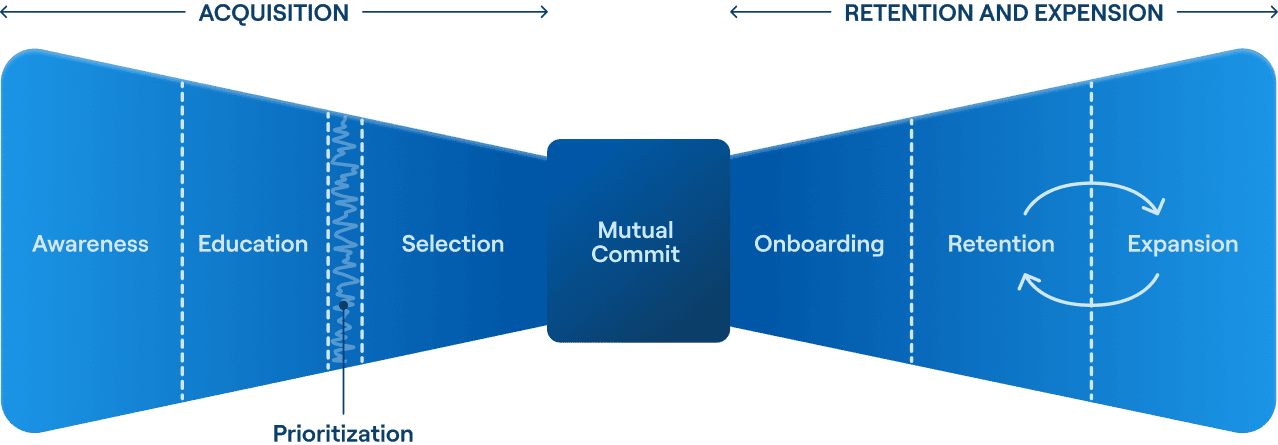
Work through a structured assessment of the key components of your commercial system. The questions are informed by established methodologies including the Bowtie model, SPICED, MEDDPICC, Obviously Awesome and Revenue Architecture.
The assessment covers 8 domains. You can pause at any time and continue later; your progress is saved automatically.
Work through a structured assessment of the key components of your commercial system. The questions are informed by established methodologies including the Bowtie model, SPICED, MEDDPICC, Obviously Awesome and Revenue Architecture.
The assessment covers 8 domains. You can pause at any time and continue later; your progress is saved automatically.
Tell us how your system runs today
Our questionnaire maps your current GTM motion without requiring formal prep. Answer at your pace, skip what's unclear, and move forward.
1
1
1
2
2
Receive your GTM Readiness Score and AI analysis
Receive your GTM Readiness Score and AI analysis
Receive your GTM Readiness Score and AI analysis
See where your organization stands across each domain and subcategory. The analysis goes beyond individual scores and identifies relationships between different parts of your Go-to-Market.
For example, it can reveal strong technology without a clear process, or a well-defined ICP without sufficiently differentiated positioning.
See where your organization stands across each domain and subcategory. The analysis goes beyond individual scores and identifies relationships between different parts of your Go-to-Market.
For example, it can reveal strong technology without a clear process, or a well-defined ICP without sufficiently differentiated positioning.
See where your organization stands across each domain and subcategory. The analysis goes beyond individual scores and identifies relationships between different parts of your Go-to-Market.
For example, it can reveal strong technology without a clear process, or a well-defined ICP without sufficiently differentiated positioning.
2
Get a prioritized action plan
Get a prioritized action plan
Get a prioritized action plan
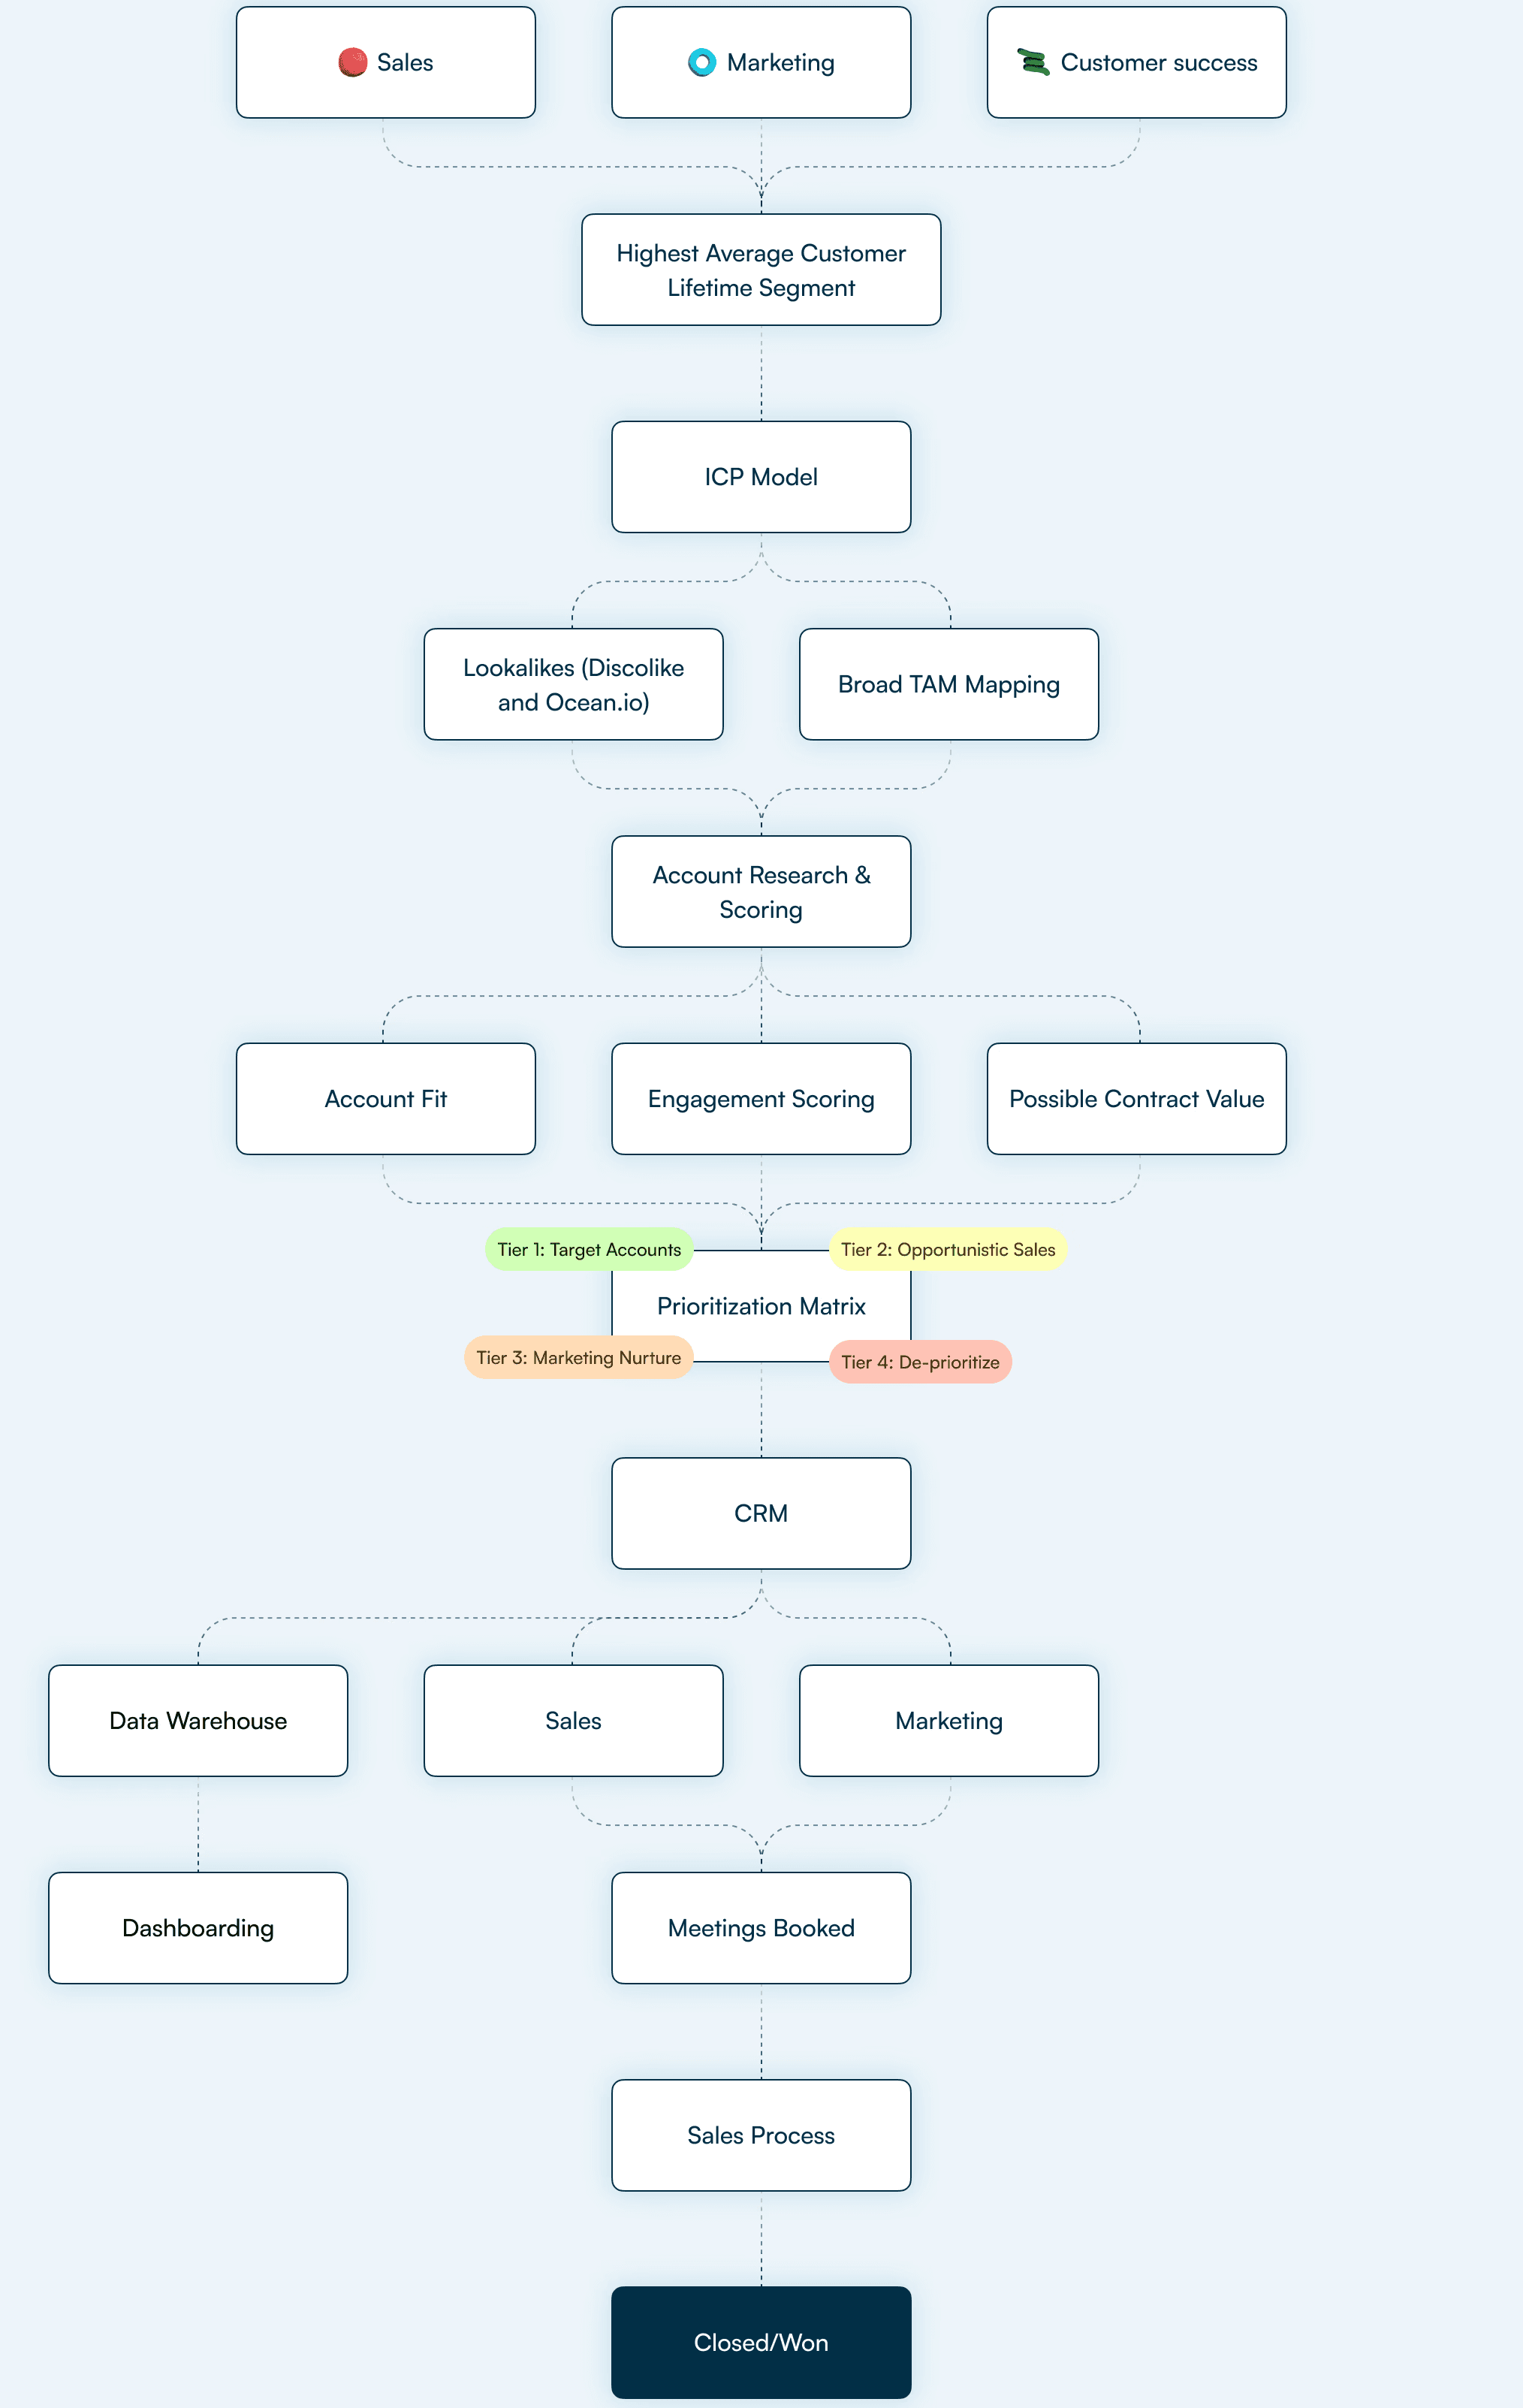
The results are translated into concrete next steps, ranked by priority and potential impact. This shows you not only what can be improved, but what deserves attention first.
Not a report that sits on a shelf, but a practical starting point for building in the right order.
The results are translated into concrete next steps, ranked by priority and potential impact. This shows you not only what can be improved, but what deserves attention first.
Not a report that sits on a shelf, but a practical starting point for building in the right order.
The results are translated into concrete next steps, ranked by priority and potential impact. This shows you not only what can be improved, but what deserves attention first.
Not a report that sits on a shelf, but a practical starting point for building in the right order.
3
3
3
GTM Readiness Scan
What you get
From diagnosis to concrete next steps
After the assessment, you have more than a score. You gain insight into where your Go-to-Market is strong, what may be limiting further growth and which areas deserve attention first.
Milestone Reached!
+4%
vs. last month
GTM Readiness Score with radar chart
See your overall readiness score and the breakdown by domain and subcategory. The radar chart makes strengths and gaps across your commercial system immediately visible.
Milestone Reached!
+4%
vs. last month
GTM Readiness Score with radar chart
See your overall readiness score and the breakdown by domain and subcategory. The radar chart makes strengths and gaps across your commercial system immediately visible.
Productivity boosted!
AI analysis and recommendations by domain
The analysis looks beyond individual scores and identifies patterns across different GTM domains. You receive targeted recommendations based on your specific results and relevant commercial methodologies.
Productivity boosted!
AI analysis and recommendations by domain
The analysis looks beyond individual scores and identifies patterns across different GTM domains. You receive targeted recommendations based on your specific results and relevant commercial methodologies.
Prioritized action plan
Receive concrete next steps ranked by impact and effort. This creates a clear sequence for what you can improve immediately, what needs to be built structurally and where additional support could add value.
DOC
Expected spike thursday
Prioritized action plan
Receive concrete next steps ranked by impact and effort. This creates a clear sequence for what you can improve immediately, what needs to be built structurally and where additional support could add value.
Case study
From diagnosis to a focused commercial approach
A strong diagnosis shows where growth is being held back and what needs to change first.

From low-quality leads to focused account prioritization
Using a targeted account list based on the Ideal Customer Profile (ICP) and a custom scoring model, we helped Van Mossel identify, prioritize and approach high-potential accounts more effectively.

From low-quality leads to focused account prioritization
Using a targeted account list based on the Ideal Customer Profile (ICP) and a custom scoring model, we helped Van Mossel identify, prioritize and approach high-potential accounts more effectively.

From low-quality leads to focused account prioritization
Using a targeted account list based on the Ideal Customer Profile (ICP) and a custom scoring model, we helped Van Mossel identify, prioritize and approach high-potential accounts more effectively.
Got any questions?
Everything you need to know about 24/SALES, before you start building your GTM system.
What's the difference between the Quick Scan and the Full Scan?
Which methodologies is the scan based on?
What does it cost?
How do you work together with our team?
How long does the scan take?
What if multiple people from our team take the scan?
What do you do with the results?
Got any questions?
Everything you need to know about 24/SALES, before you start building your GTM system.
What's the difference between the Quick Scan and the Full Scan?
Which methodologies is the scan based on?
What does it cost?
How do you work together with our team?
How long does the scan take?
What if multiple people from our team take the scan?
What do you do with the results?
Make AI part of a Go-to-Market that works
Discover where AI can genuinely strengthen your commercial team and how it can fit into your existing Go-to-Market.
Make AI part of a Go-to-Market that works
Discover where AI can genuinely strengthen your commercial team and how it can fit into your existing Go-to-Market.
Make GTM Run Like a System
Practical GTM Engineering for teams that want fewer heroics and more visibility, control, and results.